
Qb Rating Calculator
The NFL passer rating squeezes a quarterback’s passing line into one number between 0 and 158.3. Enter any stat line to see the rating, how each of the four components contributes, the NCAA college version, and what the quarterback would need for a perfect game. Add several games to rate a season properly.
- Free to use
- No sign-up
- Runs in your browser

QB rating calculator
Season from game lines
QB Stats Tracker Pack
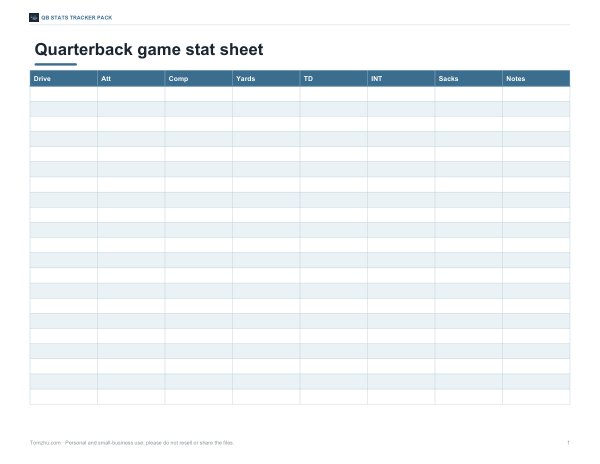
Excel season stat tracker that calculates NFL passer rating and NCAA efficiency for every game and the season from totals, a printable game stat sheet for coaches and scorekeepers, and a formula reference card.
- Season tracker (XLSX)
- Game stat sheet (PDF/DOCX/XLSX)
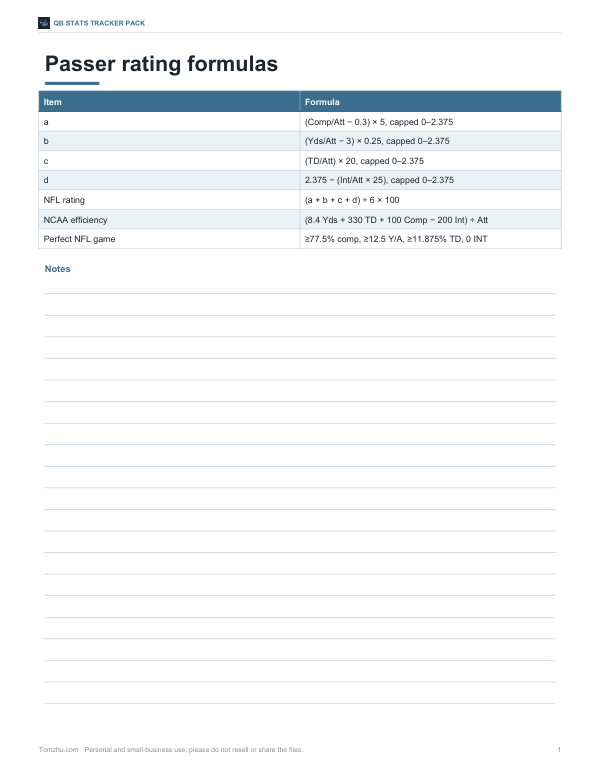
- Formula card (PDF)
Formats: XLSX, PDF, DOCX. Instant download after payment (link valid 72 hours, up to 5 downloads). AI-assisted: the templates were drafted with AI help and reviewed and laid out before publishing.
$5.00 USD, one-time 3 files · about $1.67 each
- Instant download
- 7-day refund
- Secure checkout by Stripe
7-day money-back guarantee. Full refund within 7 days of purchase, even after you download.
Full refund within 7 days — see the refund policy and license.
Free printables
Single sheets you can print right now, no sign-up. The full pack adds every sheet in one download plus the editable files.
The NFL passer rating formula
| Component | Formula | Limits |
|---|---|---|
| a — completions | (Completions ÷ Attempts − 0.3) × 5 | 0 to 2.375 |
| b — yards | (Yards ÷ Attempts − 3) × 0.25 | 0 to 2.375 |
| c — touchdowns | (Touchdowns ÷ Attempts) × 20 | 0 to 2.375 |
| d — interceptions | 2.375 − (Interceptions ÷ Attempts × 25) | 0 to 2.375 |
| Rating | (a + b + c + d) ÷ 6 × 100 | 0 to 158.3 |
Each component is capped at 2.375, so a perfect rating of 158.3 requires a completion rate of at least 77.5%, at least 12.5 yards per attempt, touchdowns on at least 11.875% of attempts and no interceptions. The CFL and many high school and youth leagues use the same formula.
Worked example
A quarterback goes 25 of 35 for 300 yards with 3 touchdowns and 1 interception. Component a = (25/35 − 0.3) × 5 = 2.071; b = (300/35 − 3) × 0.25 = 1.393; c = 3/35 × 20 = 1.714; d = 2.375 − 1/35 × 25 = 1.661. The sum is 6.839, and 6.839 ÷ 6 × 100 = 114.0. The NCAA efficiency for the same line is (8.4 × 300 + 330 × 3 + 100 × 25 − 200 × 1) ÷ 35 = 166.0.
NCAA passer efficiency
College football uses a different formula: (8.4 × yards + 330 × touchdowns + 100 × completions − 200 × interceptions) ÷ attempts. It has no upper cap, so exceptional games can exceed 200, and it can be negative. Ratings from the two systems are not comparable.
What is a good passer rating?
| NFL rating | Rough interpretation |
|---|---|
| Below 70 | Poor |
| 70–85 | Below average |
| 85–95 | Around league average in recent seasons |
| 95–105 | Good |
| Above 105 | Excellent |
| 158.3 | Perfect — the maximum possible |
League averages have risen over the decades as passing games changed, so compare ratings with players from the same era. These bands are approximate.
How each stat moves the rating
| Change (on 30 attempts, uncapped) | Effect on NFL rating |
|---|---|
| One more completion | +2.8 |
| Ten more yards | +1.4 |
| One more touchdown | +11.1 |
| One more interception | −13.9 |
Touchdowns and interceptions carry the most weight per play, which is why a single late interception can drop a good game’s rating sharply. On fewer attempts each play matters even more; on more attempts, less.
Sample stat lines
| Line (Comp/Att, Yds, TD, INT) | NFL rating | NCAA efficiency |
|---|---|---|
| 20/30, 250, 2, 0 | 114.6 | 158.7 |
| 15/30, 150, 0, 2 | 36.8 | 78.7 |
| 30/40, 350, 4, 0 | 134.4 | 181.5 |
| 10/25, 90, 0, 3 | 10.8 | 46.2 |
| 18/22, 300, 3, 0 | 158.3 | 241.4 |
| 22/35, 240, 1, 1 | 80.7 | 124.2 |
All values are calculated with the formulas above.
A little history
The NFL adopted the passer rating system in 1973 to replace a ranking method that compared quarterbacks across several separate categories. The formula was designed so that an average performance of that era would score about 66.7, with each of the four components worth 1.0 for an average passer and 2.375 as the cap. Because passing efficiency has risen greatly since then, typical ratings today are well above that original average.
Keeping stats for youth and high school games
- Count an attempt for every forward pass thrown, including incompletions and interceptions.
- Sacks are not passing attempts under most scoring rules, while a spike to stop the clock usually counts as an incomplete pass; follow your league’s scoring guide.
- Passing yards are measured from the line of scrimmage to where the play ends.
- Record stats drive by drive and total them after the game.
- Rate the season from totals, not from average game ratings.
Season and career ratings
To rate a season, add up completions, attempts, yards, touchdowns and interceptions across all games, then apply the formula once. Averaging game-by-game ratings gives a different, incorrect answer because games with more attempts should count more. The season calculator above does it the right way and shows the naive average for comparison.
Limitations
- Rating ignores sacks, fumbles, rushing and the down and distance of each throw.
- Yards include yards after the catch, which depend on receivers.
- ESPN’s Total QBR is a different, proprietary metric and cannot be calculated from box-score stats.
- For small numbers of attempts, one play swings the rating a lot.
- Dropped passes count against the quarterback, and a long catch-and-run counts for him, whatever the quality of the throw.
Privacy
All calculations run in your browser.
Frequently asked questions
What is a perfect passer rating?
158.3 in the NFL formula.
How is QB rating calculated?
From completion %, yards per attempt, TD % and INT %, each capped and averaged.
Can passer rating be negative?
Not in the NFL formula (minimum 0); the NCAA formula can be negative.
Is QBR the same as passer rating?
No — ESPN’s QBR is a separate proprietary metric.
How do I calculate a season rating?
Use season totals, not the average of game ratings.
Does the CFL use the same formula?
Yes, the CFL uses the same passer rating formula as the NFL.
Why is 158.3 the maximum?
Each of the four components is capped at 2.375; 4 × 2.375 ÷ 6 × 100 = 158.3.
How many attempts are needed for a meaningful rating?
Leagues set minimums for season leaderboards; with only a few attempts, one play can swing the rating widely.
Do spikes and sacks count as attempts?
Scoring rules generally exclude sacks from passing attempts; spikes count as incomplete passes in the NFL. Follow your league’s rules.
Is a 100+ rating good?
Yes — in recent NFL seasons a rating over 100 is generally considered very good.